NEWS | July 12, 2012
Field Work in Croplands and Forests
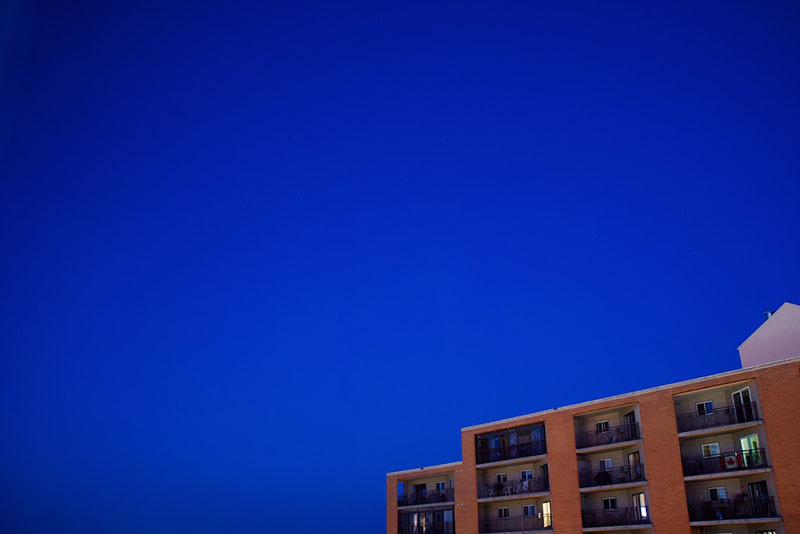
Photo 1: 10:30 pm at Winnipeg. Summer here features long hours of daylight. This may offer unique Cal/Val opportunities to obtain ground truth at the same time as SMAP.

As an avid photographer, I totally agree with what Diane Arbus said, “I really believe there are things that nobody would see if I didn't photograph them.” So here in this blog I’m taking a more photojournalistic approach. Enjoy!
My work in SMAPVEX12 primarily consisted of two tasks: Vegetation sampling in crop fields and soil moisture sampling in forests. The two tasks alternated according to PALS flight schedule and weather conditions. Because I arrived in July, my observations were all about the later phase of the campaign.
Our cropland vegetation sampling involved measurements of optical parameters (e.g., LAI and NDVI) and allometric parameters (e.g., height and diameter). On a typical day we visited up to six fields to collect data and actual plant samples.
So far we had visited wheat, soybean, canola, and corn fields. From an algorithm development standpoint, the wide range of vegetation properties represented by these fields will provide a valuable data set that would help improving radar and radiometer forward modeling efforts.
Compared with cropland vegetation sampling, forest soil moisture sampling is not for the faint-hearted (pun intended)! Not only were forest sites more remote than other sites from the ROC, but also they were less accessible by vehicles.
In one particular forest site, for example, we had to carry our supplies and tools (e.g., water, batteries, shovels, tins, knife, soil moisture probes, etc.) and walked half a mile to get to the “entrance” of the site. Soil moisture measurement in forests is a lot more time-consuming than soil moisture measurement in croplands, so we normally could not return to the base until close to 4:00 pm.
Besides remoteness and difficulty of access there were additional hurdles to be overcome. Of these, our battles with insects ranked first on the list. In almost all forest sites we visited, we were continuously bombarded by ticks, flies, and mosquitoes. In one site, we could not even kneel down to make soil moisture measurement because there were too many fire ants on the ground. These sites were not maintained (or not so regularly), so there were no clear pathways either. To move forward we had to push through tree branches after tree branches, and step over fallen trees after fallen trees. In some tough spots we even had to cut our way out using a long machete.
Despite these difficulties my field work in forests had been quite rewarding. First, I worked with a group of fun partners (Ruzbeh -- USC, Karel – U. Sherbrooke, and Alexandra – MIT). Any fatigue resulting from hard labor was usually dissipated quickly with one deep laugh or two. Second, I learned first-hand what a typical soil profile looks like, how a vegetation dielectric measurement is made, and why mixed forests pose such a challenge to theoretical modeling.
Within a week SMAPVEX12 will come to a glorious finish. My feeling is that history will confirm this is an important field campaign in terms of data quality, observation duration, biome variety, sensor diversity, sampling extensiveness, and international partnership.