NEWS | June 7, 2012
PALS Data First Look
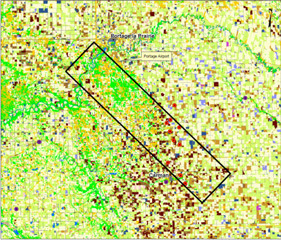
Map of study area.
Below are quick-look images from yesterday's first science flights (June 7). A single polarization each of the radiometer and radar are shown. The data are from high-altitude lines 3 through 8 (lines 1 and 2 were not acquired). For reference, the study site map is also shown (at right).
The radiometer brightness temperature (Tb) and normalized radar cross-section (sigma-0) images are uncalibrated - default parameters were used to convert instrument counts to the respective Tb and sigma-0 quantities. No external calibration has been done at this stage using the lake reference data, however the lake data were used to check that the data levels were approximately correct.
Aircraft attitude data were used to geolocate the footprints. Samples observed in non-nominal attitudes were removed. The 2-D images were created by gridding the flight line observations using straightforward 2-D interpolation over the area.
The observed spatial patterns include signatures of open water (streams, rivers, ponds), surface roughness, soil texture, surface temperature, crops, forested areas, etc., along with the soil moisture variability. The radar backscatter image does not show clearly the presence of the river at the northwest end, presumably since the backscatter is strongly influenced by surrounding vegetation particularly at the slant observation angle of PALS (40-degree incidence).
Pre-campaign software development made it possible to generate these quick-look images, which will be compared from day to day to observe moisture and vegetation changes across the study area. It should be noted that these quick-look images are not intended to be used for quantitative studies. Fully calibrated data will be made available later for this purpose.