News | August 29, 2017
Hurricane Harvey's Rapid Wind Intensification seen by NASA's SMAP
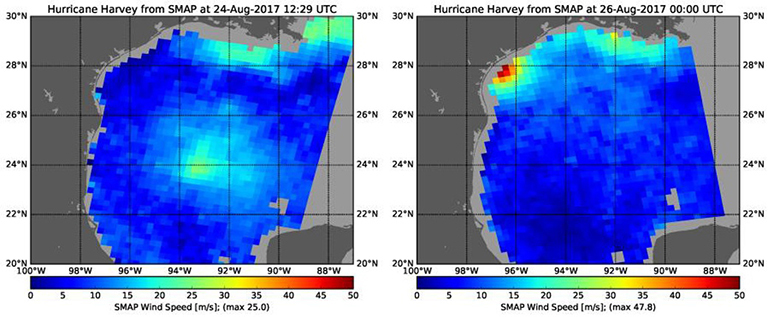
Color indicates wind speed, with red being highest and blue lowest. The images show Harvey's maximum wind speeds increased from approximately 56 mph (25 meters per second) to about 107 mph (47.8 meters per second) in the 36 hours just before landfall. Credit: NASA's Jet Propulsion Laboratory
One of the factors in tropical cyclone research that NASA studies is rapid intensification. The rapid intensification of Hurricane Harvey is seen in this pair of images of ocean surface wind speeds as observed by the radiometer instrument aboard NASA's Soil Moisture Active Passive (SMAP) satellite at 7:29 a.m. CDT Aug. 24, 2017 (left) and at 7 p.m. CDT Aug. 26 (right).
Color indicates wind speed, with red being highest and blue lowest. The images show Harvey's maximum wind speeds increased from approximately 56 miles per hour (25 meters per second) to about 107 miles per hour (47.8 meters per second) in the 36 hours just before landfall. The higher wind speeds estimated near the mouth of the Mississippi River are erroneous and are due to errors in the ancillary sea-surface-salinity data product used by SMAP to estimate extreme wind speeds.
SMAP is managed for NASA's Science Mission Directorate in Washington by NASA's Jet Propulsion Laboratory in Pasadena, California, with participation by NASA's Goddard Space Flight Center in Greenbelt, Maryland. JPL is responsible for project management, system engineering, instrument management, the radar instrument, mission operations and the ground data system. Goddard is responsible for the radiometer instrument. Both centers collaborate on the science data processing and delivery of science data products to the Alaska Satellite Facility and the National Snow and Ice Data Center for public distribution and archiving. JPL is managed for NASA by Caltech.