Multimedia
SMAP's Radiometer Captures Views of Global Soil Moisture
Source:
NASA/JPL-Caltech/GSFC
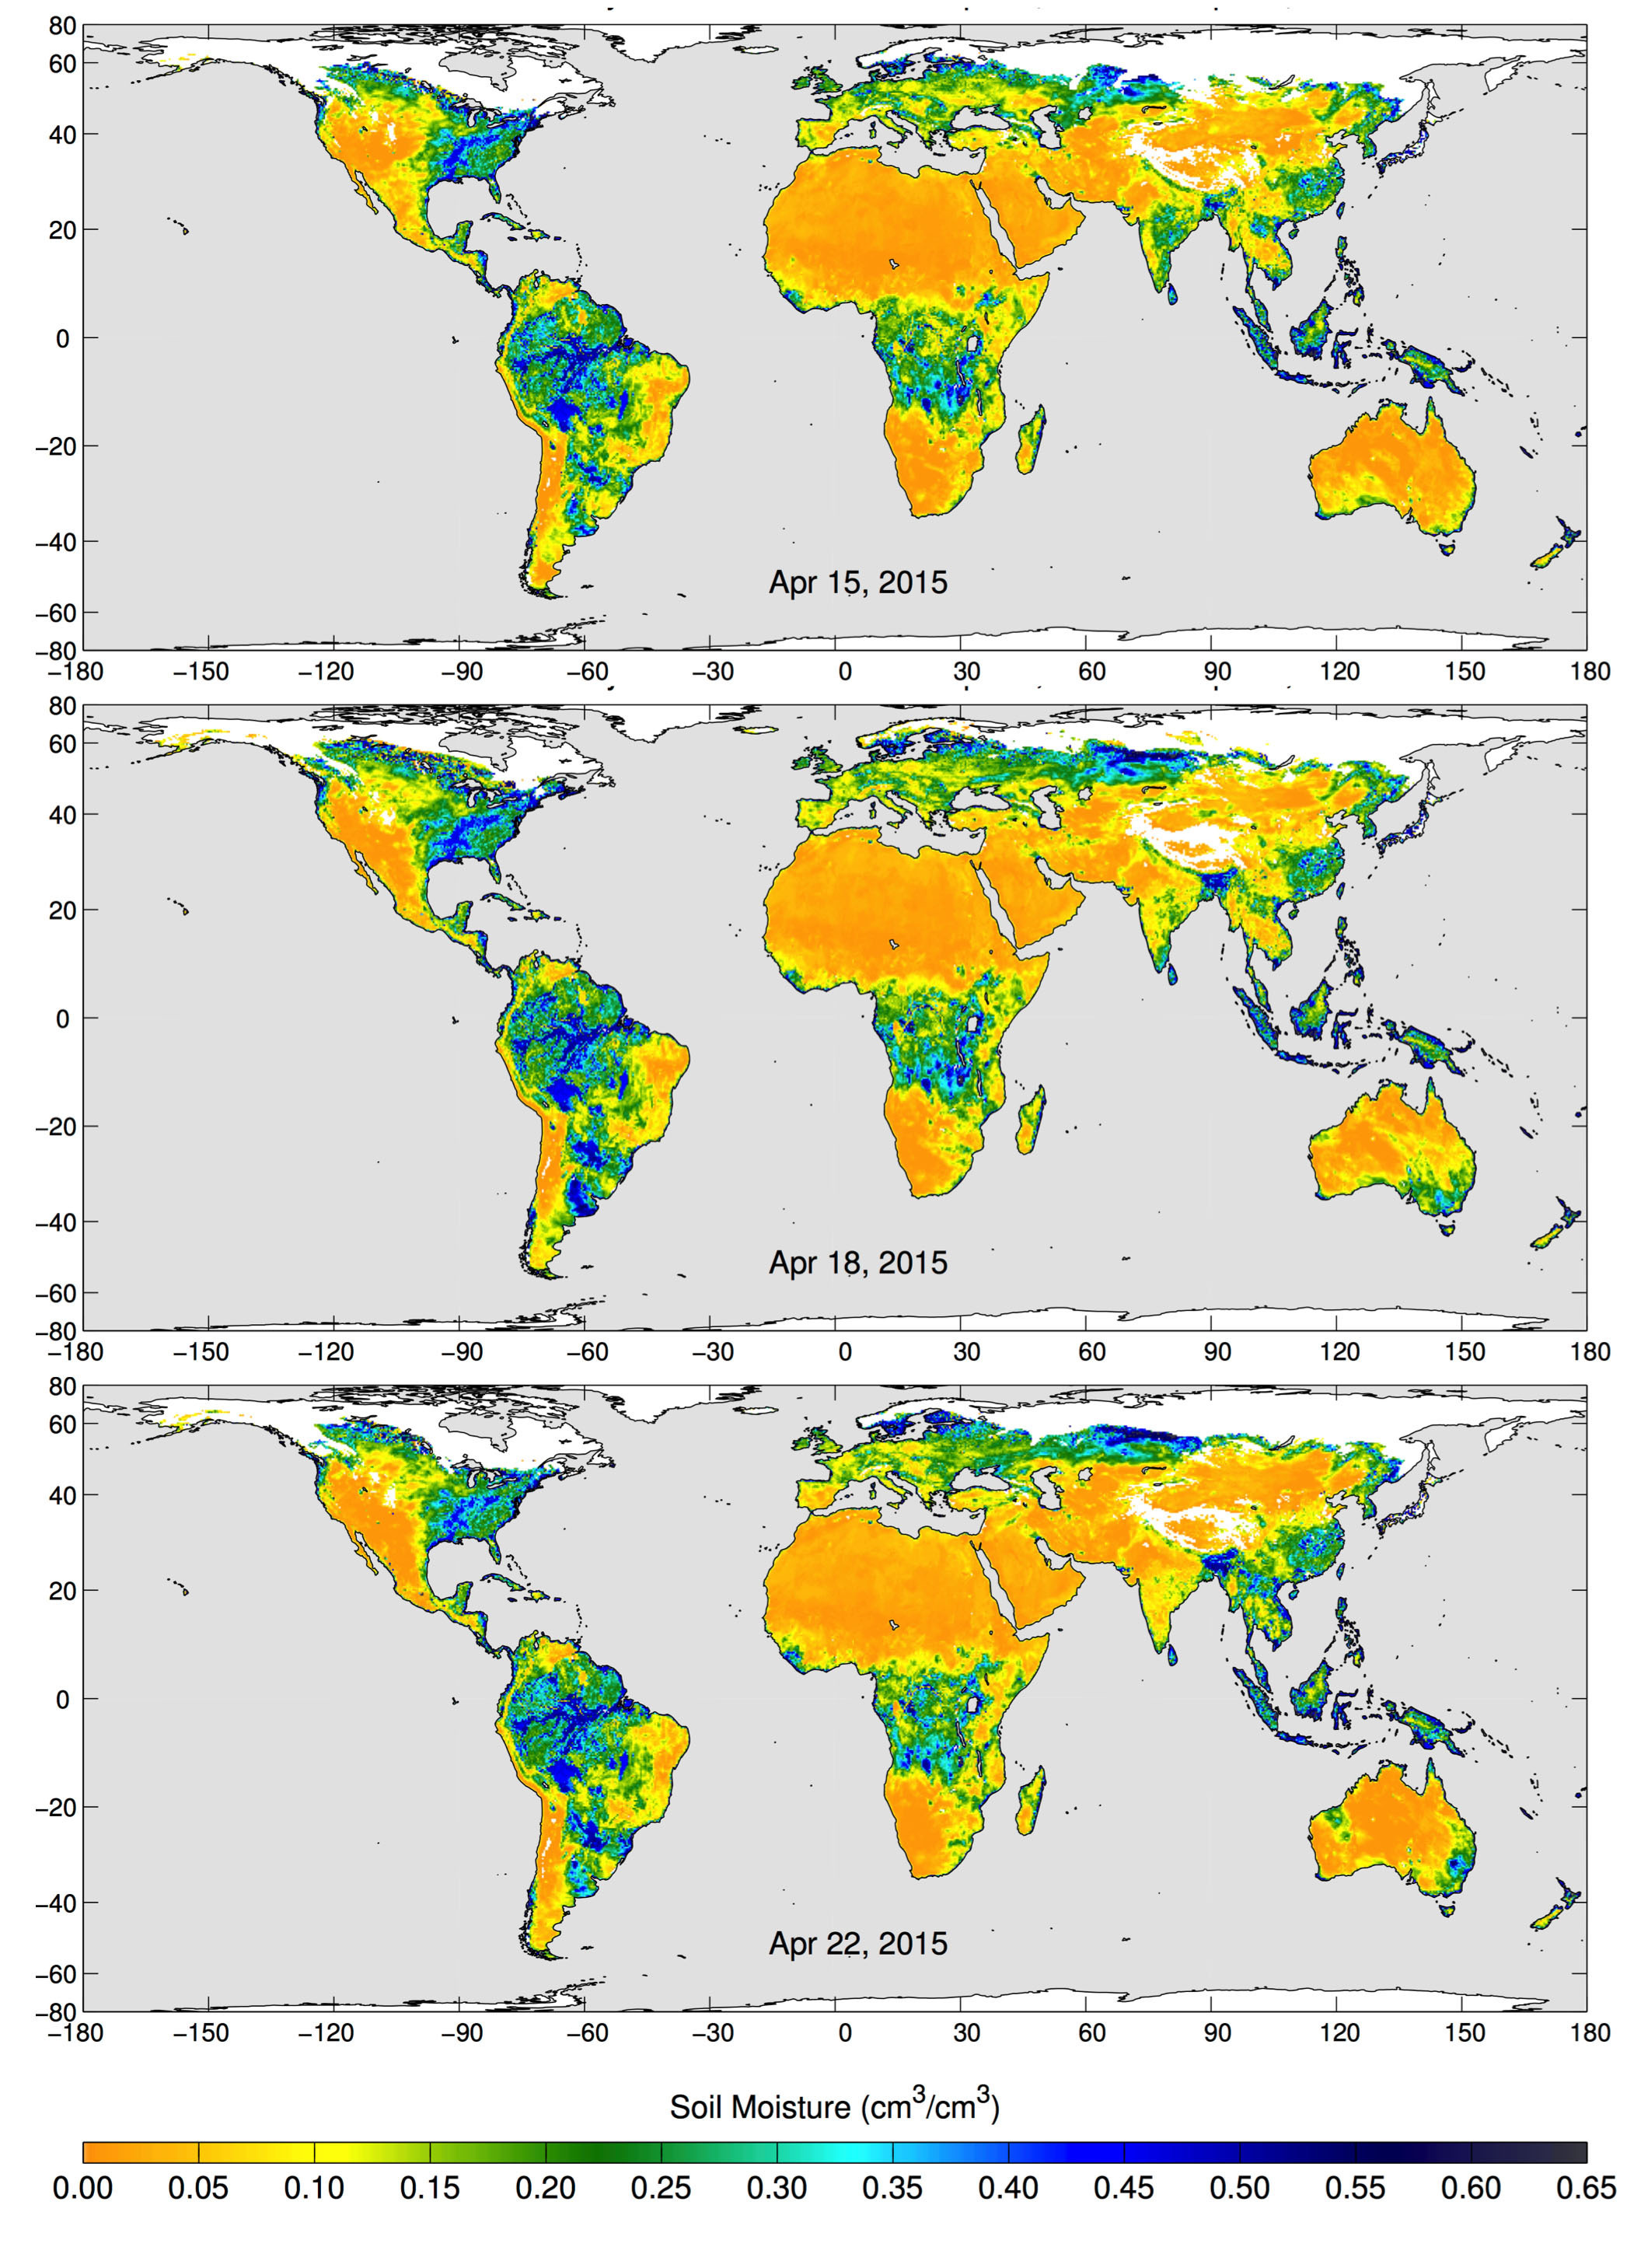
These maps of global soil moisture were created using data from the radiometer instrument on NASA's Soil Moisture Active Passive (SMAP) observatory. Each image is a composite of three days of SMAP radiometer data, centered on April 15, 18 and 22, 2015. The images show the volumetric water content in the top 2 inches (5 centimeters) of soil. Wetter areas are blue and drier areas are yellow. White areas indicate snow, ice or frozen ground.
Credit
NASA/JPL-Caltech/GSFC